Introduction
Bankruptcy filings are one of the few hard signals of financial pressure in the U.S. economy. They show where households and companies run out of options, where creditors face losses, and where restructuring work is building.
But "bankruptcy statistics" is a loose label. It can mean consumer filings, business filings, chapter mix, case outcomes, claims, recoveries, or broader distress indicators. Mixing them produces bad conclusions.
This article covers current filing trends, historical context, chapter-level patterns, business vulnerability, the limits of the data, and how professionals can put it to work.
Key Takeaways
- U.S. filings totaled 608,511 in the 12 months ending June 30, 2026, up 12.2%.
- Filing volume says nothing about outcomes such as dismissal, discharge, or confirmation.
- Raw totals, chapter mix, and industry exposure answer different questions.
- Start with court and government sources, then add structured case data.
Current U.S. Bankruptcy Filing Statistics
Latest Totals
U.S. Courts data shows the following for the 12 months ending June 30, 2026:
| Period | Total | Business | Nonbusiness | Year-over-year |
|---|---|---|---|---|
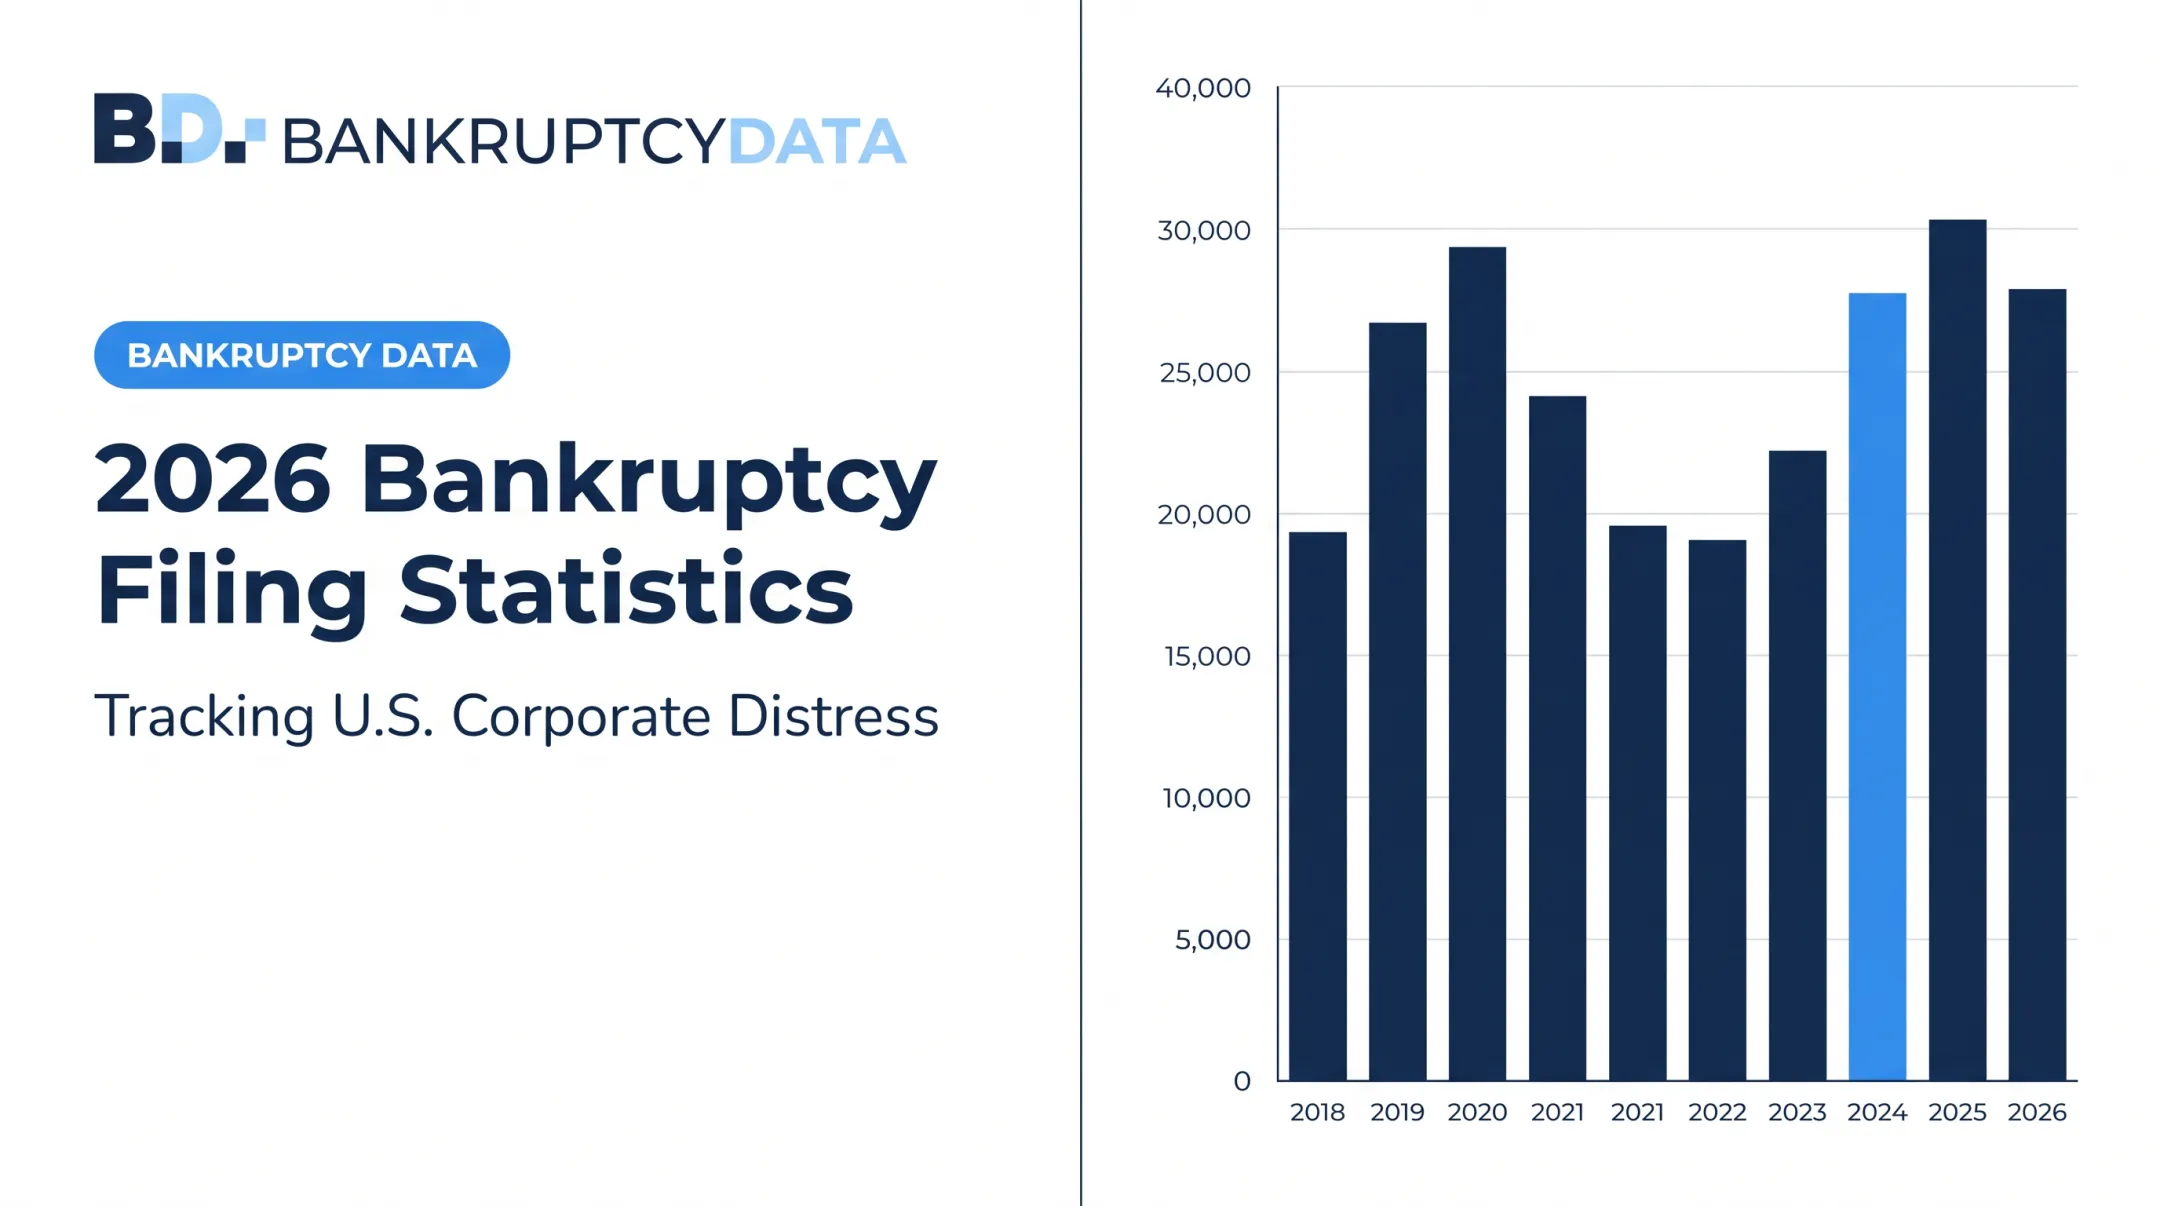
| 12 months to June 30, 2026 | 608,511 | 26,941 | 581,570 | Total +12.2%; business +16.9%; nonbusiness +12.0% |
| Calendar 2025 | 574,314 | 24,737 | 549,577 | Total +11%; business +7.1%; nonbusiness +11.2% |
| Fiscal year to Sept. 30, 2025 | 557,376 | 24,039 | 533,337 | Not comparable |
Each row covers a different 12-month window. Calendar years end December 31, fiscal years end September 30, and rolling figures end on whatever date the release states. Compare like with like.
What the Numbers Count
The current Table F-2 counts cases commenced, while the older Table 7.1 counts petitions filed. Press releases simply say "filings." Business debt is classified where the debtor is a corporation or partnership, or where business-operation debt predominates. Later tables can revise earlier totals.
Historical Context
- Petitions hit 1,782,643 in the 12 months ending June 2005, then fell to 1,112,542 a year later. The Bankruptcy Abuse Prevention and Consumer Protection Act took general effect on October 17, 2005.
- Filings peaked near 1.6 million on a rolling basis in 2010.
- Calendar 2021 filings dropped 24% to 413,616 from 544,463. The CARES Act's mortgage forbearance and foreclosure protections landed in the same window, but that is context, not proof of cause.
- Filings bottomed at 380,634 in June 2022 and have risen every quarter since, still well below 2010.

Why Volume Alone Falls Short
A total tells you how many cases opened. It doesn't say who filed, under which chapter, in what industry or district, or how the case ended. Pair counts with chapter, status, business size, and outcome wherever the source allows.
Bankruptcy Filings by Chapter and Case Type
Chapter Basics
- Chapter 7: liquidation.
- Chapter 9: adjustment of municipal debts.
- Chapter 11: reorganization, mostly used by businesses.
- Chapter 12: family farmers and fishers with regular annual income.
- Chapter 13: individual repayment plan, usually over three to five years.
- Chapter 15: U.S. proceeding ancillary to a foreign insolvency case.
Latest Chapter Mix
For the 12 months ending June 30, 2026:
| Chapter | Total | Business | Nonbusiness |
|---|---|---|---|
| 7 | 382,161 | 15,298 | 366,863 |
| 11 | 10,320 | 9,766 | 554 |
| 13 | 215,490 | 1,337 | 214,153 |
| Other (9, 12, 15) | 540 | 540 | 0 |
The "Other" group breaks down as Chapter 9: 2, Chapter 12: 336, Chapter 15: 202.
Chapter 7 dominates both business and consumer counts, but it signals different things in each. A consumer Chapter 7 often reflects household debt pressure. A business Chapter 7 usually means a wind-down. Chapter 11 is a small slice by count and a large one by economic weight.
Subchapter V
Subchapter V of Chapter 11 targets small businesses. It brings a shorter plan deadline and a trustee who helps facilitate a consensual plan.
The debt limit is $3,424,000 for cases commenced on or after June 21, 2024, after the temporary $7.5 million limit expired. A bill to restore roughly $7.5 million has passed the Senate but is not law, so check its status before citing any limit.
U.S. Trustee Program Subchapter V filings ran from 1,118 in FY2020 to 2,647 in FY2024.
Filings Versus Outcomes
For FY2020 to FY2023 small-business Chapter 11 cases, outcomes through December 31, 2024 differed sharply:
| Outcome | Non-Subchapter V | Subchapter V |
|---|---|---|
| Confirmed | 23% | 52% |
| Dismissed | 53% | 32% |
| Converted | 22% | 13% |
These figures cover U.S. Trustee Program districts only, excluding Alabama and North Carolina, and exclude certain cases that left the cohort. Never quote a "success rate" without the denominator, period, chapter, and treatment of converted or repeat cases.
Outcomes mean different things to each party:
- Dismissal returns creditors to state-law remedies
- Confirmation sets recovery terms
- Conversion shifts a case toward liquidation
Business Bankruptcy Trends and Early Distress Signals
Reading the Business Data
The official business total was 26,941 cases in the 12 months to June 2026, up 16.9%. Other datasets use different populations:
- Epiq AACER counted 7,940 commercial Chapter 11 filings in 2025, up 1%.
- Cornerstone Research counted 100 large corporate filings in the second half of 2025 and first half of 2026, 22% above its annual average of 82.
- Cornerstone also counted 28 mega filings with assets over $1 billion.
- Manufacturing, services, and finance, insurance, and real estate made up 64% of large-company filings.
- The Southern District of Texas handled 32% of those cases and Delaware 20%.

These series are not interchangeable. Sole proprietors, small firms, and complex corporate groups appear differently in each, and a jointly administered case can cover many affiliated debtors under one count.
Signals Versus Predictions
Research on distress signals goes back decades. Altman's model combines five ratios covering liquidity, profitability, leverage, solvency, and activity, and was built on 33 failed and 33 non-failed firms.
Practitioners also watch:
- Covenant pressure
- Missed payments
- Litigation
- Going-concern warnings
A signal flags elevated risk. It cannot establish that a company will file.
Distress Stages
Companies respond to pressure in different ways.
Out-of-court paths include:
- Compositions and restructuring support agreements
- Assignments for the benefit of creditors
- UCC Article 9 sales and receiverships
In-court paths include Chapter 11, Subchapter V, and Chapter 7. A Section 363 sale is a court-supervised bankruptcy tool, not an out-of-court alternative. Formal filings capture only part of distress.
Example: Bed Bath & Beyond
Bed Bath & Beyond's SEC filing for the nine months ended November 26, 2022 cited recurring operating losses, negative operating cash flow, and substantial doubt about going concern.
Credit-facility defaults followed around January 13, 2023, and a bankruptcy-court sale order came on July 11, 2023. The chronology shows reported signals followed by a court-supervised sale. It does not show that any single signal caused the filing.
What Bankruptcy Statistics Reveal About Financial Distress
Drivers Are Plural
Research points to income loss, medical expenses, high interest costs, refinancing pressure, litigation, supply-chain disruption, and weak demand. No single cause fits everyone.
- A national study of 2,314 filers in 2007 classified 62.1% as medical bankruptcies under a broad definition (Himmelstein et al.).
- A 2006 reanalysis put medical bills at 17% of personal bankruptcies under a narrower definition.
- Of the 301,103 Chapter 13 cases filed in 2014, 36% involved a filing in the prior eight years.

Those gaps come from definitions, not arithmetic errors.
Geography and Limits
State or district comparisons need both raw counts and rates adjusted for population or business counts. The national tables report counts by period and chapter, not matched rates.
A 2008 GAO review found aggregate statistics weren't designed to report causes or demographics, and some case data are self-reported and incomplete.
Filings also understate distress. Struggling households and firms use workouts, loan modifications, private restructurings, dissolution, or simply default.
How to Read the Data
- Date range: calendar, fiscal, or rolling?
- Unit: cases, petitions, or companies?
- Source: court, agency, or vendor?
- Denominator: all filers, one chapter, or one cohort?
- Chapter: liquidation or reorganization?
- Geography: counts or adjusted rates?
- Outcome definition: how are dismissed, converted, and pending cases treated?
How Professionals Should Use Bankruptcy Data
Matching Data to Work
- Law firms monitor new matters and precedent.
- Investors track filings, claims, stakeholders, and recoveries.
- Advisors build restructuring pipelines.
- Credit teams watch counterparties.
- Researchers assemble historical datasets.
A headline filing alert is only the start. Full-lifecycle intelligence covers first distress signals, petition details, docket activity, creditor and advisor changes, claims, plan milestones, and final outcomes.

Where BankruptcyData Fits
BankruptcyData, founded in 1986, is a U.S. restructuring intelligence platform. It holds 600,000+ records across 45+ years of U.S. bankruptcy activity, including court and stakeholder information, licensed datasets, API feeds, and an MCP server that connects the data to compatible AI assistants.
The platform supports research and does not replace legal or financial advice. Professionals who need structured restructuring data can evaluate it or request a demonstration.
Source Hierarchy and Responsible Use
Begin with court and government records such as U.S. Courts tables, PACER, and U.S. Trustee Program reports. Add validated academic or commercial datasets, note record update dates, and keep each metric's original definition.
- Resolve entities and remove duplicate filings.
- Track amendments, conversions, and joint administration.
- Document methodology.
- Treat no alert or score as a legal, investment, or credit decision by itself.
Conclusion: What the Latest Bankruptcy Data Means
Filing counts are a starting point. Useful analysis combines several dimensions:
- Volume and chapter mix
- Geography and industry
- Stakeholders and court activity
- Outcomes and historical context
Rising or falling filings can signal changing pressure, but meaning depends on who was measured, over what period, and under which legal framework. Verify current figures against U.S. Courts and other primary sources. When decisions depend on timely restructuring intelligence, use structured, continuously updated data.
Frequently Asked Questions
How many of Trump's companies filed for bankruptcy?
A 2016 Washington Post fact check lists six company Chapter 11 filings: Trump Taj Mahal (1991); Trump Castle, Trump Plaza, and Plaza Hotel (1992); Trump Hotels and Casino Resorts (2004); and Trump Entertainment Resorts (2009). None was personal; some counts group the early 1990s cases together.
What are the biggest companies that have failed?
"Biggest" usually means reported assets. Reuters' historical list shows Lehman Brothers (2008, $639 billion), WorldCom (2002, $103.9 billion), and Refco (2005, $33.3 billion). Asset definitions vary by filing.
Who are some millionaires who have gone broke?
Mike Tyson and his enterprise filed Chapter 11 on August 1, 2003, and Michael Vick filed Chapter 11 in the Eastern District of Virginia. Tax liens or business trouble alone don't prove a personal petition, and celebrity cases don't represent typical filers.