A single number can hide the reporting period, the case type, the chapter, the geography, and whether it's a count or a rate. Compare the wrong two figures and you reach the wrong conclusion.
This article covers recent U.S. trends, business versus nonbusiness filings, chapters and state comparisons, how to read the numbers, where the data comes from, and how professionals put it to work.
Key Takeaways
- U.S. filings reached 608,511 in the 12 months ending June 30, 2026, a rolling period, not a calendar year.
- Analyze business and nonbusiness filings separately; they reflect different kinds of distress.
- Pair raw totals with population-adjusted rates, history, and chapter breakdowns.
- Rely on court sources or documented datasets with clear field definitions.
U.S. Bankruptcy Statistics: Current Trends and Major Breakdowns
The current baseline
The latest U.S. Courts release, published July 28, 2026, covers the 12 months ending June 30, 2026. It reports 608,511 total cases, up from 542,529 a year earlier. Business cases were 26,941 (up 16.9%) and nonbusiness cases were 581,570 (up 12.0%), according to U.S. Courts.
U.S. Courts publishes rolling 12-month totals ending March 31, June 30, September 30, and December 31. So the June 2026 figure is not a calendar-year total. The figures below are calendar-year (12 months ending December 31) except the final row.
| Period | Business | Nonbusiness | Total | Ch. 7 | Ch. 11 | Ch. 13 |
|---|---|---|---|---|---|---|
| 2019 | 22,780 | 752,160 | 774,940 | 480,206 | 7,020 | 286,979 |
| 2020 | 21,655 | 522,808 | 544,463 | 378,953 | 8,333 | 156,377 |
| 2021 | 14,347 | 399,269 | 413,616 | 288,327 | 4,836 | 120,002 |
| 2022 | 13,481 | 374,240 | 387,721 | 225,455 | 4,918 | 157,087 |
| 2023 | 18,926 | 434,064 | 452,990 | 261,277 | 7,456 | 183,956 |
| 2024 | 23,107 | 494,201 | 517,308 | 310,631 | 8,884 | 197,244 |
| 2025 | 24,737 | 549,577 | 574,314 | 356,724 | 9,201 | 207,889 |
| 12 months to June 2026 | 26,941 | 581,570 | 608,511 | 382,161 | 10,320 | 215,490 |

Source: U.S. Courts Table F-2. Other chapters (under 1,000 cases a year) are omitted.
The long arc
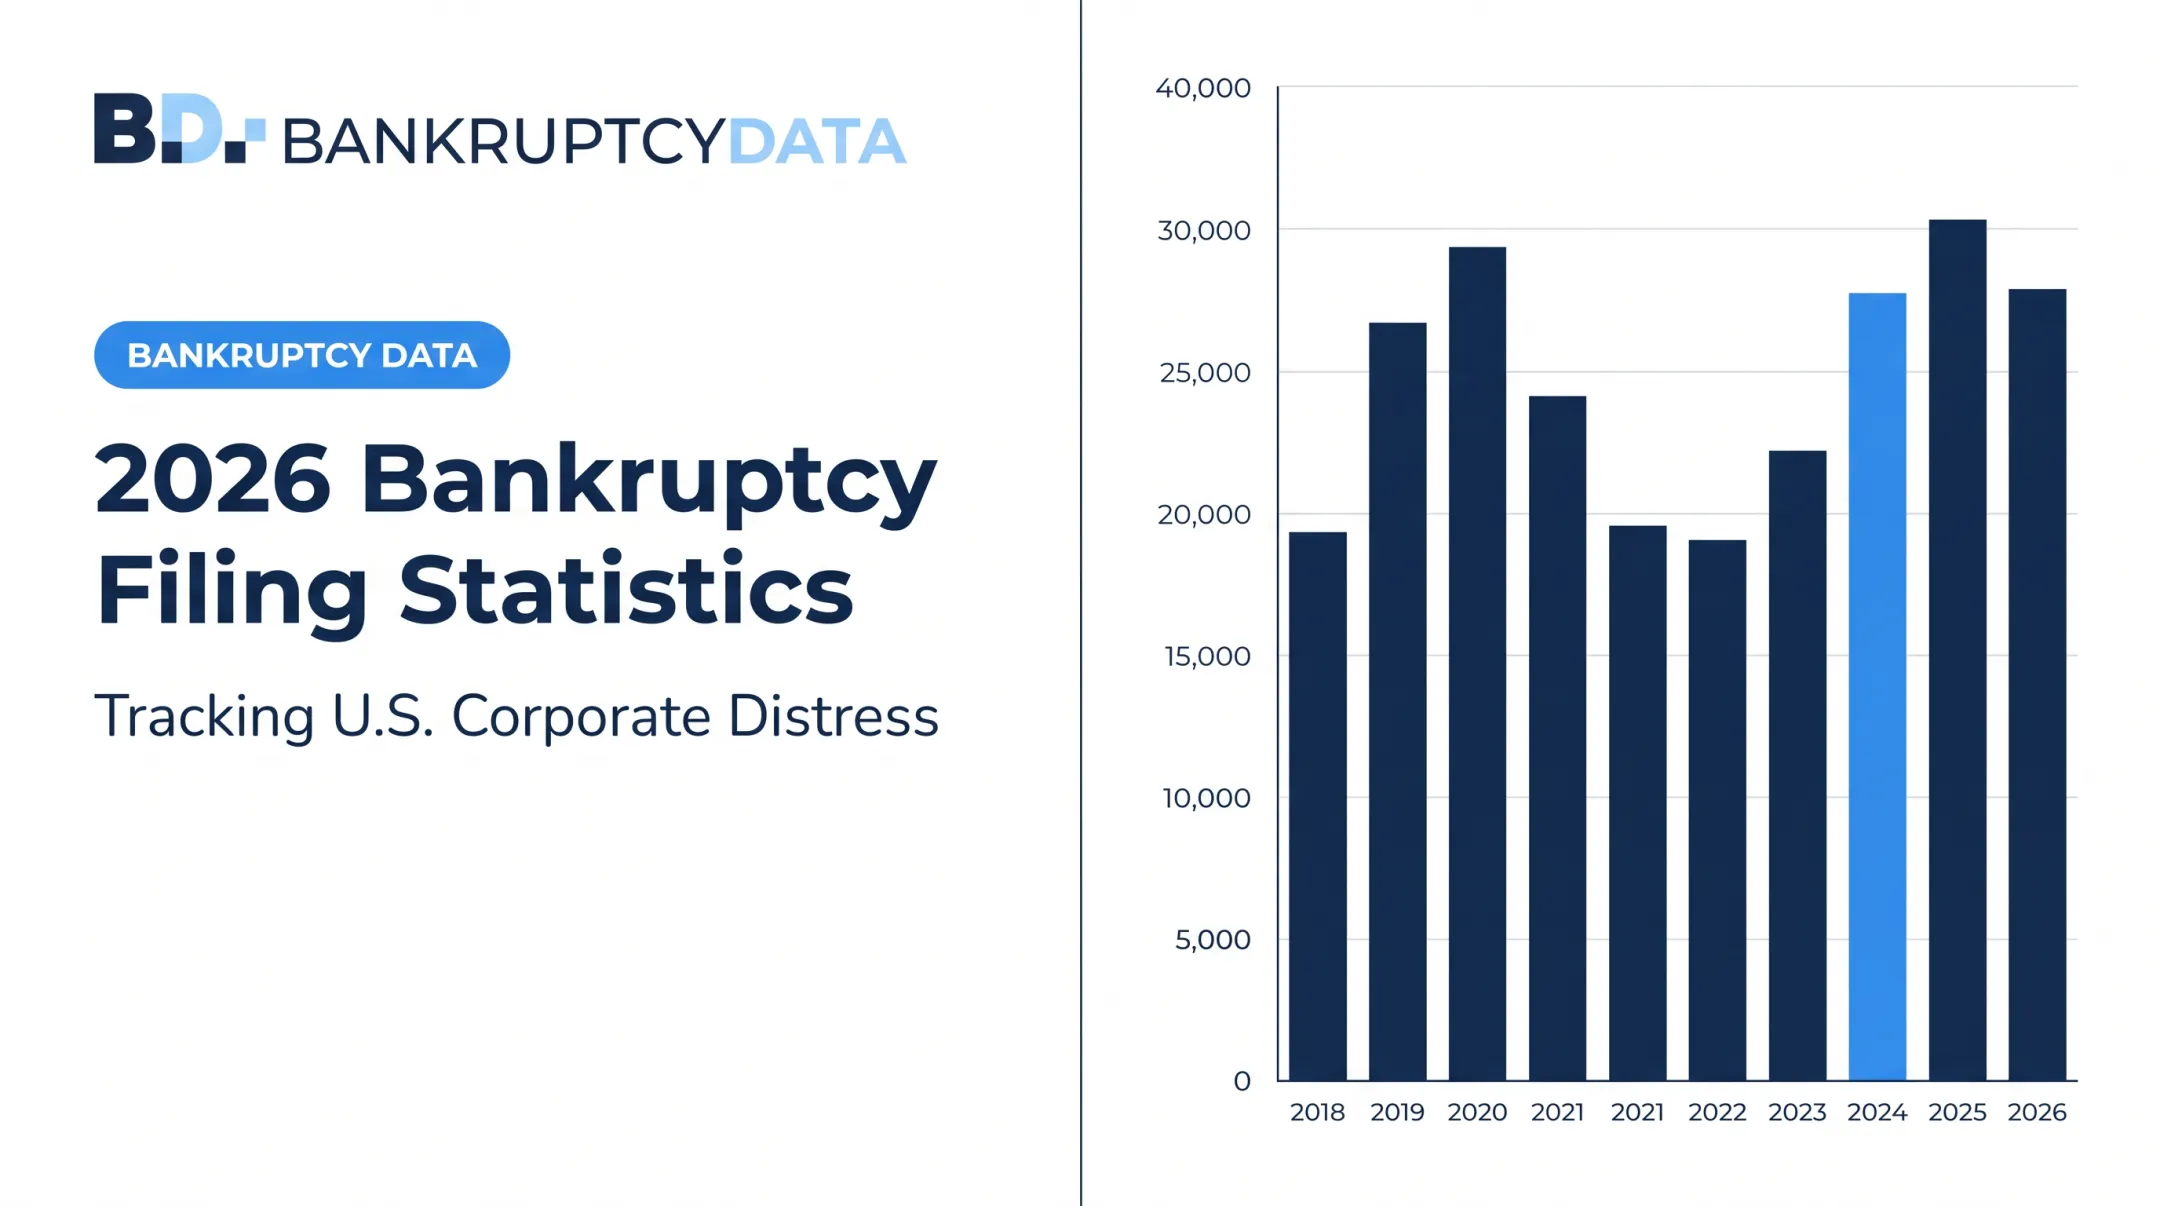
Filings fell from 774,940 in 2019 to 413,616 in 2021, then dipped again in 2022 to 387,721. The rebound started in 2023 and has run since. Calendar-year 2025 was 11% above 2024.
A Harvard Business School study of the COVID period found Chapter 13 consumer filings stayed 55% to 65% below 2019 levels through August 2020. Chapter 7 filings recovered from mid-April, after stimulus checks went out. The authors stress that timing alone doesn't prove relief caused the rebound, and the same caution applies to the post-2022 rise.
Business versus nonbusiness
Business cases are only about 4% of the total (4.4% in the latest period). They still matter far more than their share suggests. A single Chapter 11 can touch thousands of creditors, employees, suppliers, and investors, and it often signals sector stress earlier than consumer data does.
The F-2 table classifies cases by "predominant nature of debt." Business bankruptcy includes a business debtor or an individual with business-related debt, so the label isn't a precise description of legal form.
Chapters in practice
- Chapter 7: liquidation. A trustee gathers and sells nonexempt assets. About 63% of recent cases.
- Chapter 11: reorganization, typically for commercial enterprises that keep operating. The debtor generally remains in possession until a plan is confirmed, or the case is dismissed or converted.
- Chapter 13: an individual with regular income repays all or part of their debt over three to five years. About 35% of recent cases.
State comparisons
Raw state totals mislead because populations differ. Using Census July 2025 population estimates, filing rates for the 12 months ending June 30, 2026 are:
| State | Cases | Cases per 100,000 residents |
|---|---|---|
| California | 58,111 | 147.7 |
| Tennessee | 22,800 | 311.7 |
| Vermont | 308 | 47.8 |
California has far more cases than Tennessee, yet Tennessee's rate is more than double. These are illustrative calculations, not published U.S. Courts rates.
One 2009 cross-state study found demographics, wage-garnishment limits, and the Chapter 13 share explained 70% of variation in state filing rates. That finding is one study, not a universal rule.
How to Interpret Bankruptcy Statistics
Key terms
- Petition: the filing that starts a case, voluntary by the debtor or involuntary by creditors.
- Debtor: the person, business, or entity the case concerns.
- Discharge: the order that bars collection on dischargeable debts.
- Dismissal: termination of a case without a discharge, for example when a plan can never be formulated.
- Business/nonbusiness: a classification of cases by predominant nature of debt.
Precise official distinctions among pending, terminated, and closed cases are not always published the same way. Check the glossary of whichever dataset you use.
Counts, rates, changes, and shares
A count is raw cases. A rate divides by a denominator, such as cases per 100,000 residents. A percentage change compares two periods. A share is a slice of the total.
Worked example from the table: business filings rose from 24,737 in 2025 to 26,941 in the 12 months to June 2026. Business share of total moved from 4.3% to 4.4%. Changes in count and in share can tell different stories, and the periods aren't equal in kind (calendar year versus rolling year).
What drives the numbers
Filing totals can reflect debt burdens, interest rates, employment, court access, policy changes, ending relief programs, or reporting-period differences. Public data alone does not support a firm causal attribution for the current rebound. Treat any single-cause explanation with suspicion.
A court total also undercounts distress. People avoid filing, and firms restructure out of court. One older study of 169 distressed exchange-listed firms from 1978 to 1987 found 80 successful out-of-court restructurings. That sample is historical, not a current estimate.
How to read a bankruptcy statistic
- Source: is it the court system or a secondary aggregator?
- Date range: calendar year, fiscal year, or rolling 12 months?
- Unit: cases, not people.
- Case type and chapter: business, nonbusiness, 7, 11, or 13?
- Geography: national, state, or district?
- Denominator: is it a count or a rate, and which population vintage?
- Status: the F-2 tables don't display a preliminary or revised flag, so confirm with the publisher.

Where Bankruptcy Data Comes From and How to Evaluate It
Primary sources and what they answer
| Source | Best for | Watch for |
|---|---|---|
| U.S. Courts F-2 and F-5A | National and district/county counts by chapter | Rolling 12-month periods |
| PACER | Case-level dockets and documents | Fees: $0.10 per page, capped at $3 per document |
| FJC Integrated Database | Downloadable case data with codebooks | Federal fiscal year (Oct. 1 to Sept. 30) from 1993 |
| FRED and Census | Economic context, population denominators | Not filing counts |
| Florida-UCLA-LoPucki database | Large public-company Chapter 7 and 11 cases | Not updated after December 2022 |
PACER's case locator isn't fully real time. Newly filed cases typically appear within 24 hours, and the court holds the most recent data.
Free public datasets carry authority and transparency. They also tend to be fragmented, hard to search, slow to update, or missing fields. A national docket-field dictionary is not readily available.
Structured versus unstructured
NIST defines structured data as having a predefined model and unstructured data as lacking one. In bankruptcy:
- Structured: case number, filing date, chapter, district, debtor type, status, disposition.
- Unstructured: petitions, schedules, motions, docket text, opinions, creditor documents.
Data modeling for research teams
A usable model links debtors, cases, courts, filings, stakeholders, advisors, claims, events, and outcomes. Keep source provenance and time sequence on every record so any figure traces back to a document.
Quality-control checks
- Duplicate entities and name variations
- Amended filings and transferred cases
- Missing values and inconsistent chapter labels
- Fiscal versus calendar periods
- Differences between official records and commercial aggregators
A professional resource
BankruptcyData is one example of a restructuring intelligence resource. It offers a subscription platform with live court reporting, docket monitoring, stakeholder tracking, and historical benchmarking, covering 600k+ records across 45+ years of U.S. bankruptcy activity. It focuses on corporate filings, so it complements, rather than replaces, the national consumer-heavy court totals above.
How Professionals Use Bankruptcy Data
Law firms and advisors
Restructuring lawyers and advisors use filing, docket, and historical outcome data to monitor active cases, research precedent, and support pitches. BankruptcyData lists advisor roles, fee applications, and league tables under its professional fees coverage, which supports mandate research.
Investors, lenders, and credit teams
Distressed-debt investors combine distress signals, capital-structure information, docket developments, and outcomes for diligence. Credit teams monitor customers and counterparties for filing exposure.
Published evidence of that monitoring is still modest. An NBER study reviewed 132 Chapter 11 cases (1998-2009) and 28,072 trade-credit contracts. In roughly a quarter of cases, at least one informed supplier discussed the client's bankruptcy in its own financial statements. That shows supplier information in one sample, not a market-wide practice. Data informs analysis; professional judgment still decides.
Data vendors, fintechs, and analytics teams
Teams that license datasets use bulk delivery or APIs to feed internal systems and automate alerts. BankruptcyData offers licensed datasets and API data feeds for internal analytics, proprietary research, and AI-enabled workflows.
Its MCP server connects compatible AI assistants to its datasets for case research and saved searches. The Model Context Protocol is an open standard for linking LLM applications to external data and tools.
A basic monitoring workflow
- Define the universe: the companies, sectors, or counterparties to watch.
- Set event fields: filing date, chapter, court, debtor, status.
- Ingest and validate: check new filings for duplicates and amendments.
- Map entities: link debtors to affiliates, creditors, and advisors.
- Trigger alerts: notify the right team on a match.
- Keep source links: every record points back to its document.

Conclusion: Making Bankruptcy Statistics More Useful
The strongest analysis pairs current totals with history, chapter and debtor-type splits, geographic rates, clear definitions, and source checks. A 608,511 headline means little until you know it's a rolling 12-month count of cases.
Match the dataset to the question:
- Public statistics for broad trends
- Court records for case-level verification
- Structured professional data for repeat monitoring and workflow integration
Frequently Asked Questions
Where can I find free publicly available datasets?
Free public sources include U.S. Courts F-2 and F-5A tables, the FJC Integrated Database, FRED, and Census data. PACER charges fees. Granularity, update frequency, and licensing vary, so check each source's terms.
What data fields are typically included?
Typical fields include filing date, chapter, court district, debtor type, and case status. Richer records add docket events, claims, stakeholders, and final outcomes.
What is unstructured data?
Unstructured data lacks a consistent tabular format. In bankruptcy, that includes petitions, court opinions, docket text, motions, schedules, and creditor documents.
What is data modeling?
Data modeling organizes entities, relationships, events, and fields so cases can be queried consistently. It lets users connect filings with stakeholders, documents, timelines, and outcomes.